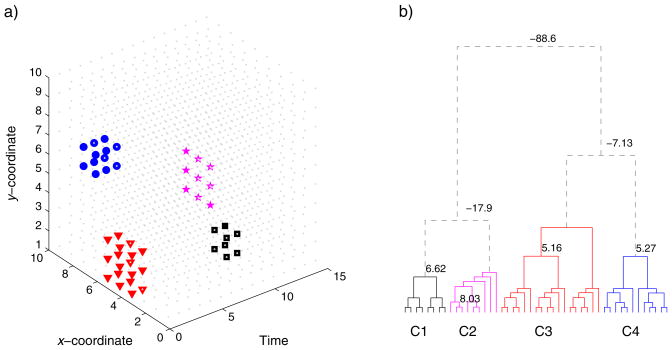
Figure 3.
Demonstration of spatiotemporal clustering in a 3-D space. a) We set up four ‘hot spots’ in different shapes that extend through space and time (see text for details). b) Clustering in the hierarchical tree. The algorithm prunes the tree where the odds ratio of the merged hypothesis falls below the split hypothesis, identifying four distinct clusters.

