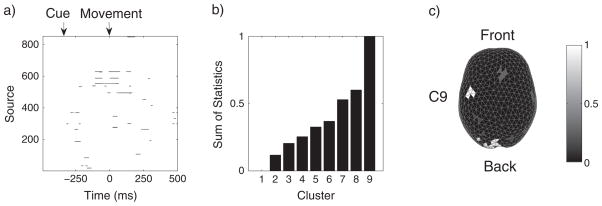
Figure 4.
Spatiotemporal region of interest analysis of a magnetoencephalography study in a visuomotor task. a) Map of time-evolving chi-square statistics of 853 sources thresholded at αthresh = 0.01 for subject S1. The black dots indicate test statistics that exceed threshold. b) Normalized sums of statistics of nine spatiotemporal clusters found using the STE algorithm for S1. Cluster 1 consists of under-threshold space–time events. Cluster 9 has the maximal sum of statistics and corresponds to the contralateral motor area (on the right). c) Spatial visualization of ROI on the cortical surface. The white area indicates the cluster with the maximal sum of statistics.

