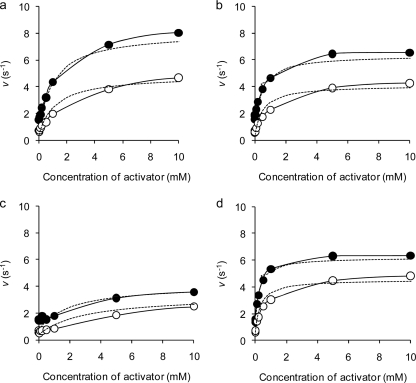
Fig 2.
Activator-reaction rate plots for hydrolysis of maltose. Reaction rates for 4.5 mM (open circles) and 50 mM (solid circles) maltose were measured in the presence of various concentrations of monovalent cations. The averages of at least two measurements less than 5% standard deviation are shown. Theoretical lines (dotted lines) were drawn on the basis of Equation 1 and measured kinetic parameters. (a) K+; (b) Rb+; (c) Cs+; (d) NH4+.

