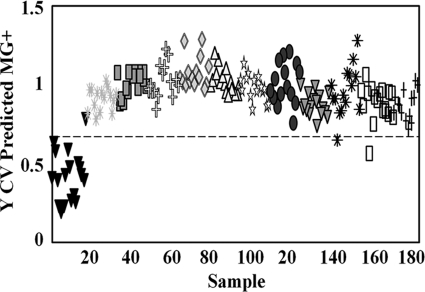
Fig 2.
PLS-DA output of serial dilutions of Rlow. Samples were classified as positive or negative for M. gallisepticum, with the horizontal dotted line indicating the threshold for a 50% probability that the samples are being misclassified. The initial concentration was 4.7 × 10⁵ CFU/μl (gray asterisks). Solid inverted triangles, methanol control. The remaining symbols denote increasing serial 10-fold dilutions (100 to 10−10) from left to right. Results are shown for the samples (n = 183), with 3 latent variables capturing 26% of the x variance and 81% of the y variance. Cross-validated sensitivity, 98%; cross-validated specificity, 94%.

