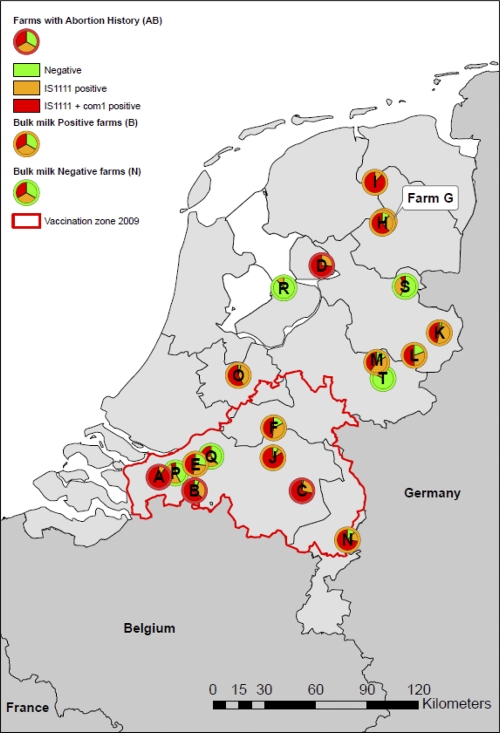
Fig 1.
Screening for C. burnetii DNA in animal and environmental matrices on 19 dairy goat farms and 1 dairy sheep farm in the Netherlands. Farm categories (categories AB, B, and N) are indicated by red, orange, and green pie chart borders, respectively. The proportions of negative, IS1111-positive, and IS1111- and com1-positive samples are indicated in green, orange, and red, respectively.

