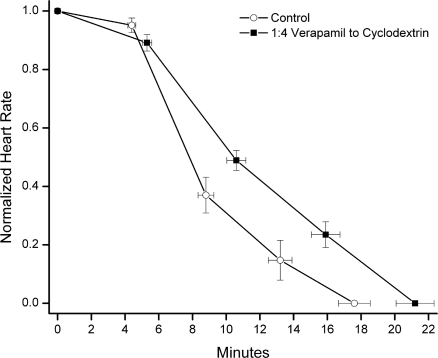
Figure 2.
Normalized heart rate versus time to asystole for control and group 4 (1:4 verapamil to sulfobutylether-β-cyclodextrin). Values are indicated as mean normalized heart rate ± standard error (vertical error bars). Measurements are plotted from the beginning of drug infusion and at 25% increments of time to asystole. The horizontal error bars denote the variability in time to asystole between groups. Mean heart rate did not differ between groups. Time to asystole was significantly shorter in the control group (17.6 vs 21.2 minutes, P < 0.05).

