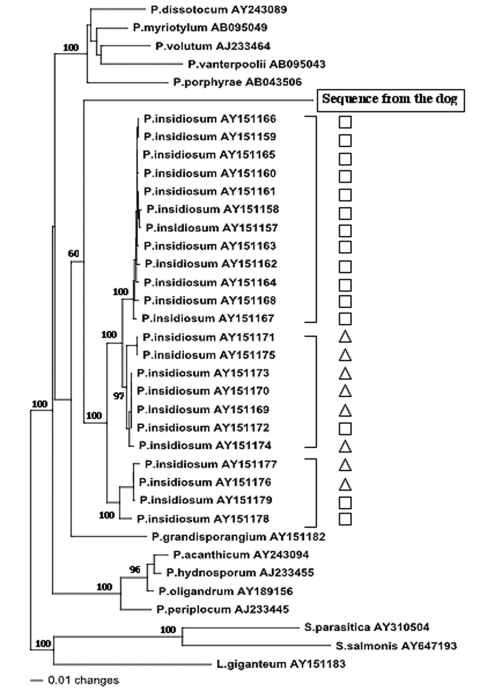
Figure 3.
Evolutionary tree of 37 internal transcribed spacer (ITS) and 5.8S rRNA sequences from oomycetes. Each sequence is identified by a Genbank accession number. Shown are 23 sequences from Pythium insidiosum from America (□) and Asia/Australia (△). The phylogram presented resulted from bootstrapped data sets (3) using parsimony analysis (heuristic search option in PAUP 4.0). This tree was identical to the consensus of 17 most parsimonious trees generated from the branch and bound algorithm in PAUP 4.0. The percentages above the branches are the frequencies with which a given branch appeared in 1,000 bootstrap replications. Bootstrap values below 50% are not displayed. The evolutionary distance between two sequences is obtained by summing the lengths of the connecting branches along the horizontal axis, using the scale on the bottom. Lagenidium giganteum (AY151183), Saprolegnia parasitica (AY310504), and S. salmonis (AY647193) were chosen as outgroups.

