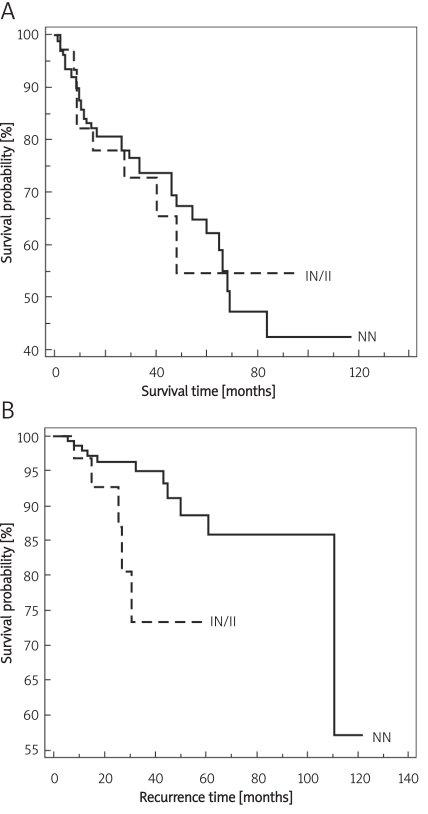
Figure 1.
Kaplan-Meier curves for the survival time (p = 0.02) (A) and recurrence time (p = 0.89) (B) for patients according to the CBS 844ins68 polymorphism. There was statistical difference between the curve for subjects with at least one polymorphic allele (I or IN genotype) with survival time NN – non-insertion, II – polymorphic, IN – heterozygous

