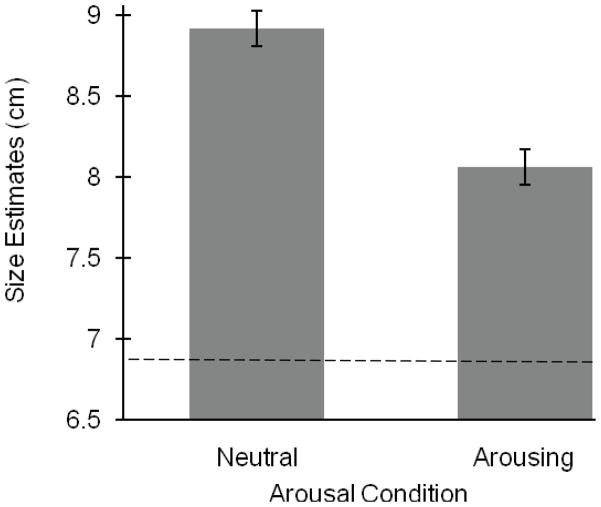
Figure 6.
Results for Experiment 5a. The y-axis represents the average width estimates for the neutral and arousing conditions. Participants judged the width to be significantly smaller after viewing the arousing images. All bars represent one standard error. Horizontal line represents the average of the actual board widths.

