
Figure 3. Effects of PLAID-Associated PLCG2 Deletions, Including Increased Phospholipase Activity, Deceased Cellular Activation at Physiologic Temperatures, and Enhanced Cellular Activation at Subphysiologic Temperatures.
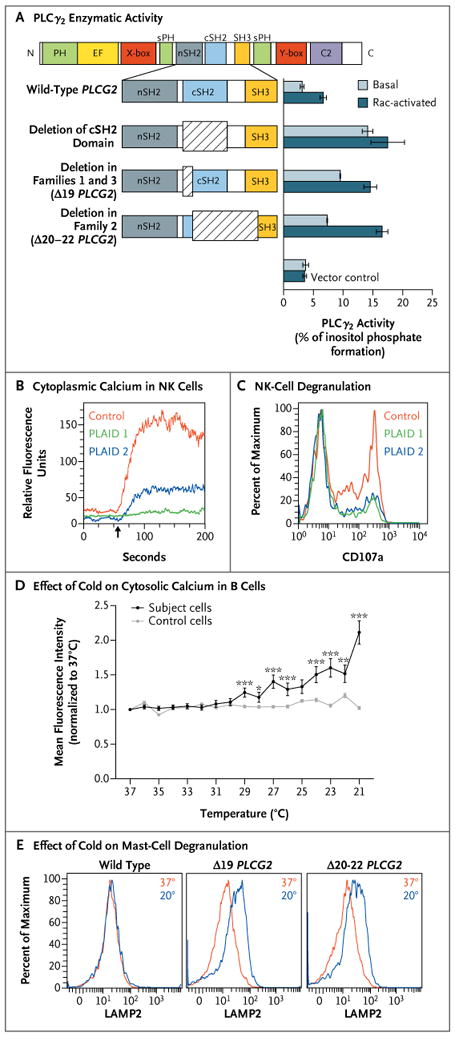
Panel A shows enzymatic activity of phospholipase Cγ2 (PLCγ2) mutants. COS-7 cells were transfected with DNA encoding either wild-type PLCG2 or PLCG2 with deletions of the C-terminal Src homology 2 (cSH2) domain, exon 19 (Δ19), and exons 20 through 22 (Δ20–22) (at left). PLCγ2 activity was assayed by quantification of [3H] inositol phosphates generated by the respective enzymes (at right). Basal activity was quantified in COS-7 cells transfected with PLCG2 alone, whereas the Rac-activated condition included cotransfection with a Rac2 V12 expression construct. The I bars indicate 1 SD above and below the mean release of inositol phosphate for each condition. Data are representative of three independent experiments. C2 denotes calcium-binding C2 domain, EF EF hand motif, nSH2 N-terminal SH2 domain, PH pleckstrin homology domain, SH3 SH3 domain, sPH split pleckstrin homology domain, X-box × catalytic domain, and Y-box Y catalytic domain. Panel B shows cytoplasmic calcium content (as measured by FLUO-4 staining) in natural killer (NK) cells before and after surface-receptor cross-linking (arrow indicates time of administration) in two subjects with PLAID and one control subject. Panel C shows degranulation of NK cells after incubation with sensitive target cells, as measured by cell-surface expression of CD107a as a percent of the maximum CD107a expression observed in control NK cells. Panel D shows the effect of temperature reduction, in the absence of surface stimulation, on cytosolic calcium content in B cells sorted from a case subject and a control subject, as measured on confocal microscopy. Data points reflect the average mean fluorescence intensity of 100 individually imaged cells, and I bars indicate standard errors. Data are representative of three independent experiments. One asterisk indicates a P value of 0.01 to 0.05, two asterisks indicate a P value of 0.001 to less than 0.01, and three asterisks indicate a P value of less than 0.001. Panel E shows mast-cell degranulation, as indicated by the surface expression of lysosomal-associated membrane protein 2 (LAMP2) and measured by means of flow cytometry at 37°C (red) and 20°C (blue) in Laboratory of Allergic Diseases 2 (LAD2) human mast cells transfected with wild-type and deleted forms of PLCG2.