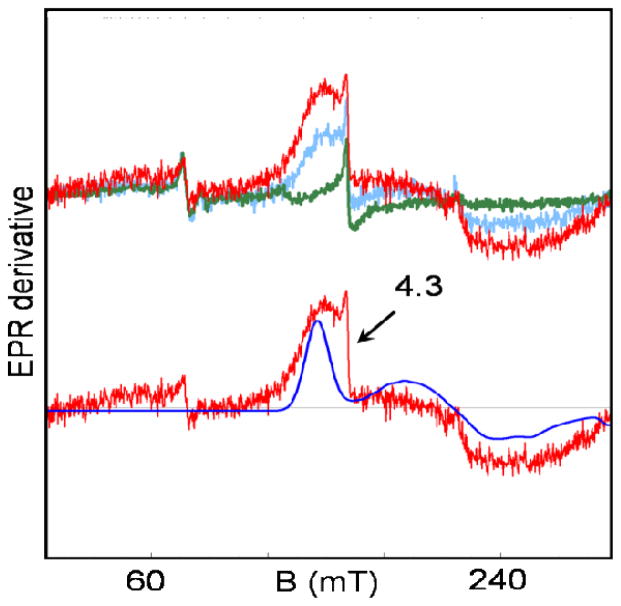
Figure 5.
EPR spectra of 1 in PrCN in the low field region recorded at T = 8 K (green), 21 K (blue) and 34 K (red). The blue line in the lower trace is a simulation of the 34 K spectrum with eq 1, using the parameters listed in Table 4. To simulate the approximate line shape, EB/DB was assumed to have a Gaussian distribution with σE/D = 0.04. The feature at g = 4.3 is due to a minor S = 5/2 contaminant. Conditions: 9.62 GHz, 0.2 mW microwave power, 1 mT modulation; 1 hour accumulation time for the 34 K spectrum.

