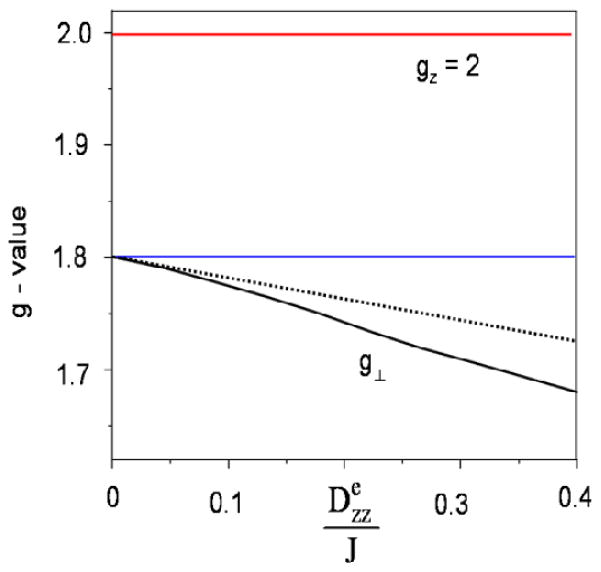
Figure 9.
Illustration of D/J mixing on the effective g-values of an FeIIIFeII system. For clarity we have made the following simplifying assumptions. . The solid lines in black and red were obtained by diagonalization of eq 1. The dashed line for gx = gy = g⊥ was generated by using the perturbation expression of eq 8. The difference between the blue horizontal line at and the solid line for g⊥ is due to D/J mixing.

