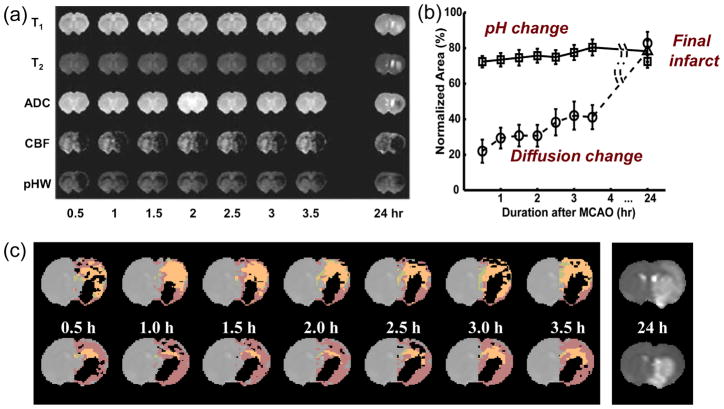
Figure 4.
Multi-parameter MRI as a function of time after permanent MCAO in the rat. (a) Example in which no T1, T2, and ADC changes were seen, but ischemia was confirmed by hemispheric CBF reduction (obtained using arterial spin labeling) and a pHW deficit measured by APT imaging. Hyperintensity in the T2 image at 24 hrs gives the final infarction area. (b) Group analysis of ischemic volume evolution for 18 rats with perfusion/diffusion mismatch, comparing areas of APT change (pH) and diffusion change as fraction of the perfusion-deficit region. The pHW region predicted well the evolution to infarction. (c) Processed images for two other animals showing evolution of pHW deficit (orange) and diffusion deficit (black) with respect to perfusion deficit (purple) as a function of time post-MCAO. The T2 image at 24 hrs shows final infarction area predicted well by diffusion + pH regions. (Reproduced in part, with permission, from Sun PZ, et al. J Cereb Blood Flow Metab. 2007;27:1129–1136.)

