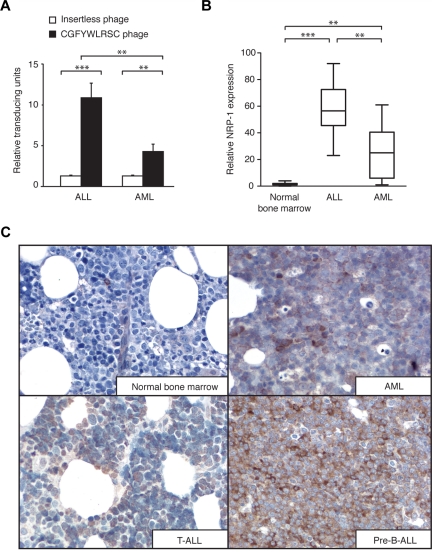
Figure 5.
NRP-1 expression in leukemia bone marrow samples. (A) Binding of peptide-displaying phage or insertless control phage to bone marrow specimens of AML and ALL patients. **P < .01; ***P < .001. (B) Immunohistochemical staining for NRP-1 on ALL, AML, and normal bone marrow specimens. The amount of positively stained cells in the specimen represents the approximate levels of NRP-1 expression. *P < .05; **P < .01; ***P < .001. (C) Representative examples of immunohistochemical staining of NRP-1 (brown) on AML, T-cell ALL, and pre-B–cell ALL and normal bone marrow specimens are shown. Magnification, 500×.

