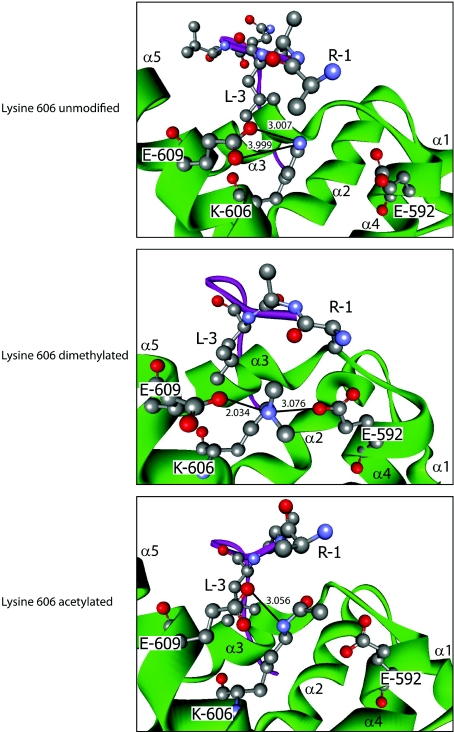
Figure 5. Effects of Lys606 modification on PABP1 PABC–eRF3-N PAM2 interaction.
Modelling of the interaction between human PABP1 PABC (green) and the eRF3-N PAM2 motif (purple) when Lys606 is dimethylated (middle panel) or acetylated (bottom panel), based on the crystal structure of unmodified PABC [18] (top panel). Key residues are numbered according to their position in full-length PABP1 or the eRF3-N PAM2 motif (1–12). Depiction, labels and colour scheme are as in Figure 4.

