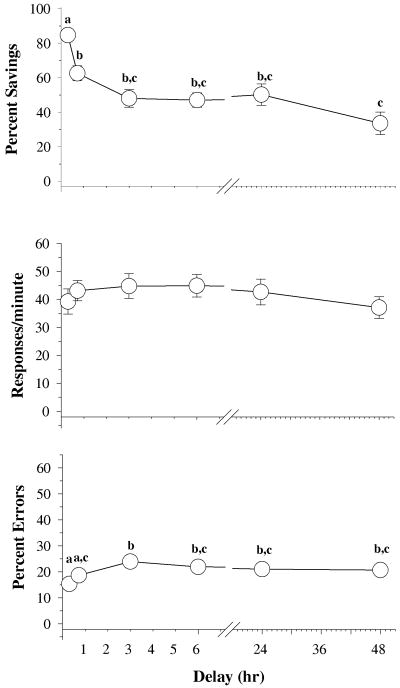
Fig. 1.
Effects of delay on overall percent savings, response rates and percentage of errors in 23 subjects. Symbols with error bars represent the mean ± SEM, while any points without vertical lines indicate instances in which the SEM is encompassed by the data point. Letters indicate significant differences within delay (α ≤ 0.05) as determined by a one-way ANOVA and Holm-Sidak post-hoc tests.

