
Fig. 4.
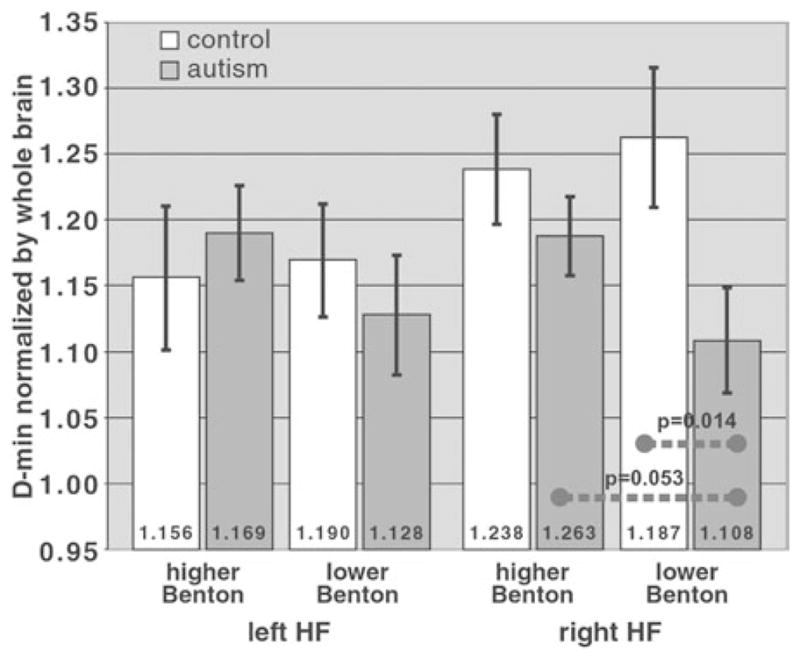
Comparison of the HF pathways to Benton facial recognition test scores. For the right HF pathway, which had a reduction in the normalized D-min in the autism group compared with controls in Figure 2c, this reduction is more severe when considering the two subgroups with lower Benton scores (right-most white and gray bars), with p =.014 (one-tailed; corrected threshold .025 for two comparisons for the right HF pathway). Also, within the autism group, the normalized D-min in the right HF pathway was more severely reduced in the lower-Benton subgroup compared with the higher-Benton subgroup (p =.053; one-tailed).