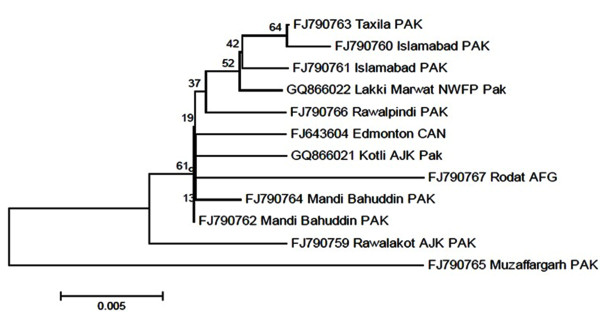
Figure 1.
Evolutionary Relationships of Taxa. The percentage of replicate trees in which the associated Taxa clustered together in the bootstrap test (500 replicates) is shown next to the branches [25]. The tree is drawn to scale, with branch lengths in the same units as those of the evolutionary distances used to infer the phylogenetic tree. Abbreviations used: PAK-Pakistan, CAN-Canada and AFG-Afghanistan.

