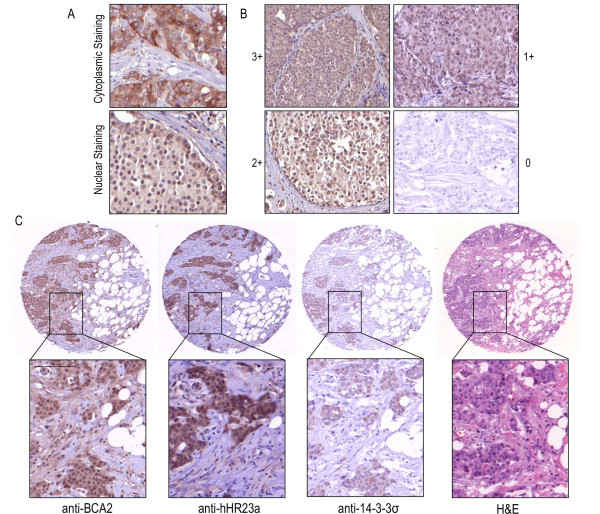
Figure 3.
Immunohistochemistry of breast cancer TMA (n = 105). [A] An example of how tumors were scored for protein localization. The top panel is staining positively in the cytoplasm with no nuclear staining, the bottom panel shows a tissue which is staining weakly in the cytoplasm and stongly in the nuclear compartment. [B] Shows examples of the criteria for staining intensity, where 3+ (top left) has the strongest staining/most intense and 1+ (top right) which has the weakest staining/least intense. A tissue staining negatively (0), is also shown (bottom right). [C] Shows a typical staing pattern for a serial section of the same tumor at 5 × magnification and 20 × magnification for BCA2, hHR23a and 14-3-3σ immunostaining, aswell as H&E staining.

