Figure 4.
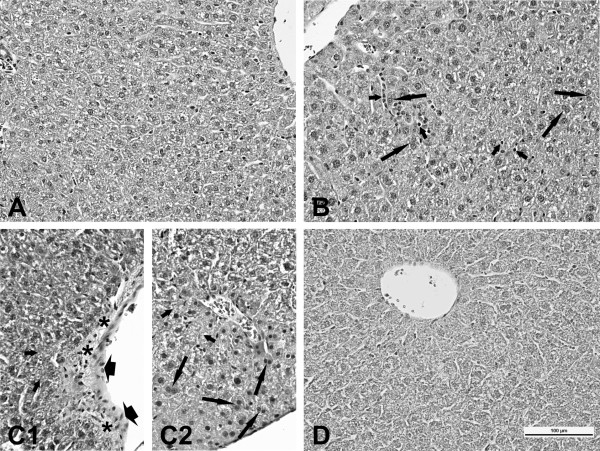
Liver histology. Microscopic pattern of the liver mice: A (vehicle exposed control animals) - normal structure; B (mice exposed to NanoTiO2 - 24 h after exposure) - infiltration of inflammatory cells (short arrows), binucleate hepatocytes (long arrows); C (mice exposed to Printex 90 - 28 days after exposure) - microfoci of necrosis (short arrows), C1 - edematous of endothelial cells (head of arrows), hyperplasia of connective tissue (asterisks), C2 - binucleate hepatocytes (long arrows); D (dust from Indoor-NanoTiO2 - 3 days after exposure) - normal structure; staining HE, magnification as scale on the figure D.

