Figure 2.
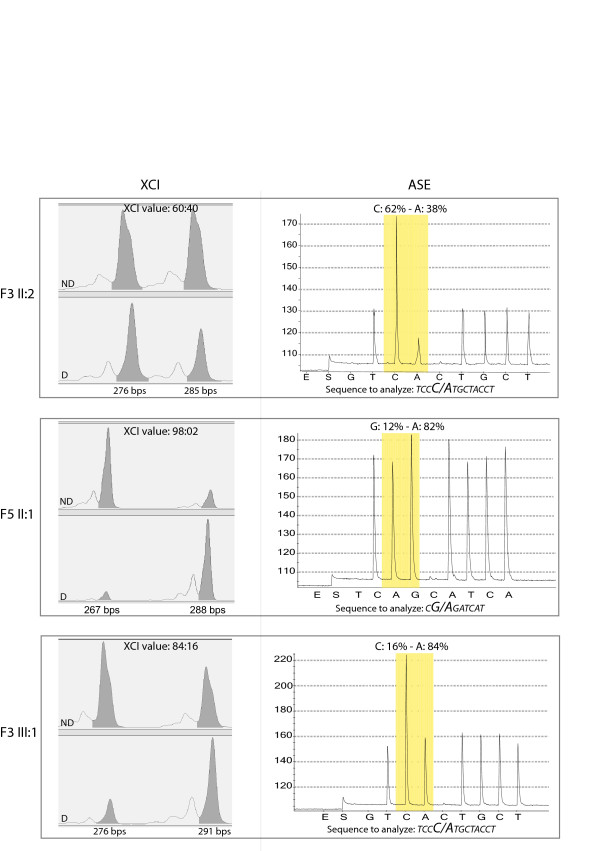
X Chromosome Inactivation (XCI) and ABCD1 Allele-Specific Expression (ASE) results in three representative samples. In the left column the electropherograms of HUMARA alleles ND (upper) and D (lower) are depicted. For each sample, the peak lengths (bps) and the corresponding area are indicated. The XCI results (ratio) are reported. In the right column the pyrograms of ASE experiments are shown and the analysed sequences of cDNA, containing the mutations (the base-change is highlighted in bold), are indicated. The mutation site is boxed in grey and the ASE (percentage of wt: mutant allele) is indicated. Sample F3 II-2shows a random XCI pattern and only a slight imbalance in ABCD1 ASE, suggesting that ABCD1 follows XCI; sample F5 II-1is characterized by severe skewing of both XCI and ABCD1 ASE, with an evident preferential expression of the mutant allele; in F3 III-1 sample XCI is moderately skewed, as well as the ABCD1 ASE. ND = DNA not digested D = DNA digested.

