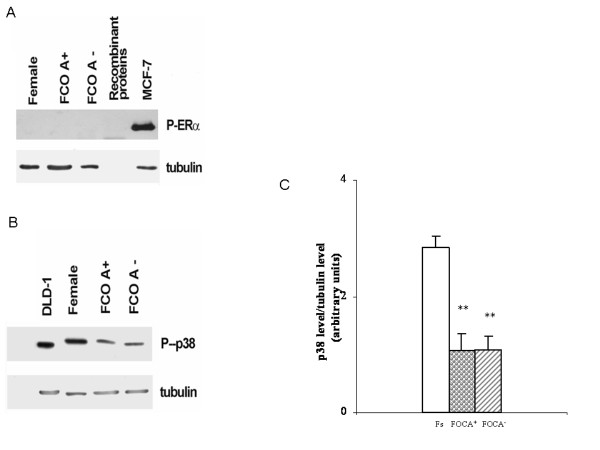
Figure 3.
Activation status of estrogen receptors. Representative western blot for estrogen receptor α phosphorylation (A) and representative western blot with corresponding densitometric analysis of estrogen receptor β activity (measured as p38 phosphorylation) (B, C) in estrogen receptor α-expressing MCF-7 and estrogen receptor β-expressing DLD-1 cell lines stimulated with 10 nM estradiol (1 h) and in monocyte-derived macrophages (MDMs) from Fs (white bar), FOCA+ (circle bar) and FOCA- (striped bar). Data are expressed as the mean ± SD of at least four independent experiments. **P < 0.001 vs Fs. FOCA+/FOCA- = FOCs further stratified as a function of androgenic (FOCA+) and non-androgenic (FOCA-) properties of progestins; FOCs = women treated with OCs for at least 3 months; Fs = women who had not used OCs for at least 3 months to ensure a sufficient washout period; OC = oral contraceptive.

