Figure 3.
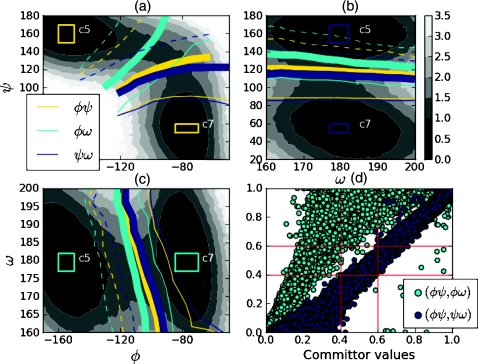
Selected contours of the average iso-committor probabilities in three coordinate systems: (a) (ϕ, ψ); (b) (ω, ψ); (c) (ϕ, ω) with the free energy contours in intervals of 0.5 kT depicted in gray scale. The average iso-committor contours displayed are 0.1 (dashed), 0.5 (thick), and 0.9 (thin). The correlation between iso-committor probabilities obtained with different definition of reactants and products is reported in (d). The correlation plot shows that the different iso-committor probabilities strongly disagree about the location of the equi-committor. In the worst case, the ϕψ and ϕω equi-committor surfaces do not overlap at all. Definitions of reactants and products in each coordinate system are represented as rectangles. 3% of equilibrium population in the c5 iso-committor reactant rectangle in the (ϕ, ω) coordinates, and 1% of the ψω c7 iso-committor rectangle, is separated by the χ1 separatrix. The ϕψ iso-committor rectangles do not cross the χ1 separatrix.

