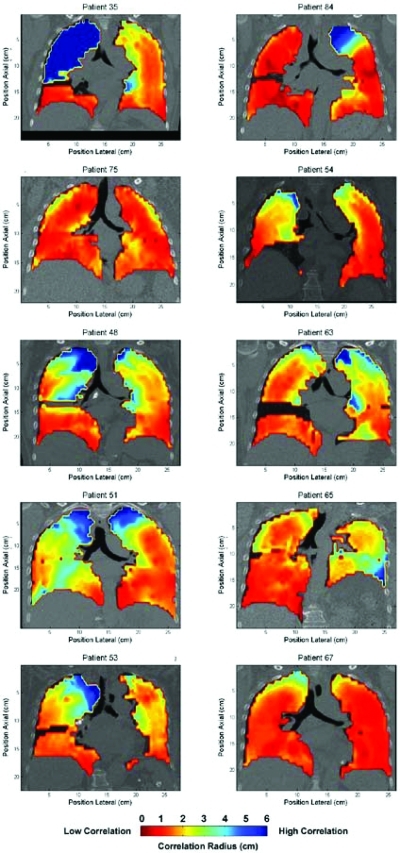
Figure 3.
Correlation radii maps. Regularly spaced voxel within the lung were analyzed using the process described in Fig. 1. Correlation maps were produced to display how well the anatomy correlates with adjacent anatomy within the thoracic cavity. Red indicates low correlation with surrounding anatomy motion, blue indicates high correlation.

