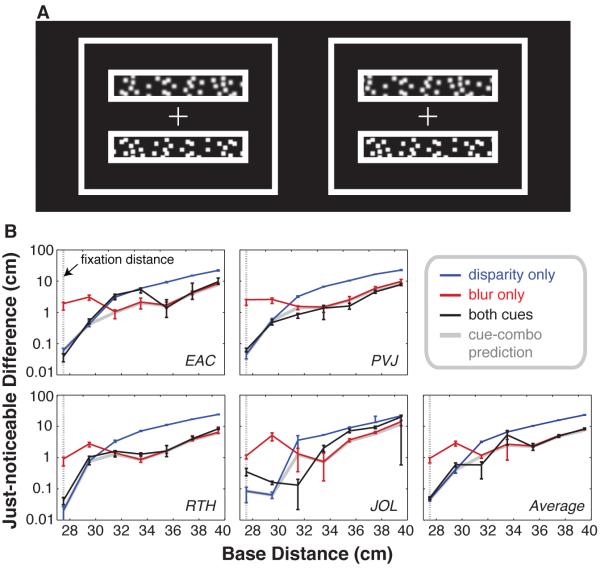
Figure 2.
A. Cross-fusable stereo pair of an example stimulus. Observers fixated the central cross and reported whether the lower or upper patch was farther away. Blur has been added to simulate the appearance of a stimulus with disparity and focus cues available. B. Depth-discrimination thresholds plotted as just-noticeable differences for disparity, blur, and both cues conditions. Subjects fixated and focused at a distance of 27.5cm (dotted line). Pedestal stimuli are indicated on the abscissae. The ordinates represent the just-noticeable difference in depth for each pedestal distance. Blue, red, and black lines represent performance using disparity only, blur only, and both blur and disparity. The gray line represents the predicted behavior if the visual system combined the cues optimally [23]. Disparity outperformed blur when the pedestal stimulus was within 3mm of fixation, while blur outperformed disparity at greater distances. Four of the panels show individual subject data and the fifth shows the across-subject average data. Error bars represent standard error.

