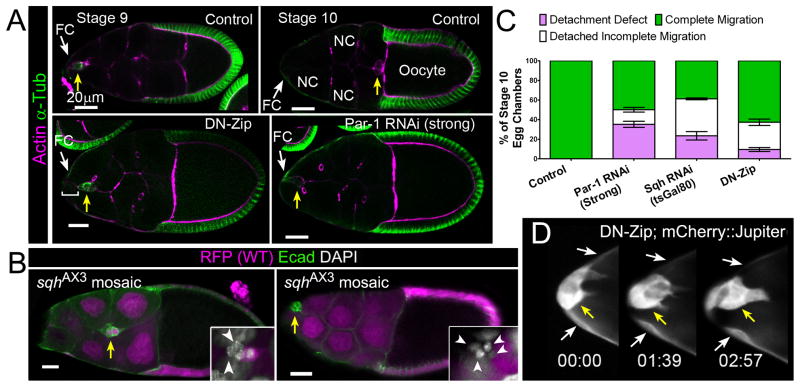
Figure 1. Myo-II Regulates Border Cell Detachment and Migration.
(A) Egg chambers (subunit of the ovary) of the indicated genotypes stained for F-actin (magenta) and α-Tubulin (green). Arrows indicate border cells (yellow) and follicle cells (FC; white). Scale bar, 20 μm. (Top) Normal border cell migration in control (c306-GAL4/+) stage 9 (left) and stage 10 (right) egg chambers. Nurse cells (NC) and oocyte are indicated. (Bottom) Stage 10 egg chambers expressing UAS-DN-Zip (left) or UAS-Par-1 RNAi Strong (right) driven by c306-GAL4; border cells did not migrate and are visibly attached to an anterior FC (bracket). (B) Border cell migration (arrows) in stage 10 sqhAX3 mosaic mutant egg chambers stained for E-cad (green) to mark cell membranes and DAPI to mark nuclei (white, insets); clones are marked by loss of nuclear mRFP (magenta). Partially mutant clusters migrate partway to the oocyte (left), whereas completely mutant clusters do not detach (right). Scale bar, 20 μm. (Insets) Magnified views of border cell clusters; mutant border cells are indicated (arrowheads). (C) Quantification of migration in stage 10 egg chambers of the indicated genotypes, shown as the percentage that did not detach (purple), or detached with incomplete (white) or complete (green) migration. Error bars represent SEM; n ≥ 350 egg chambers in ≥ 3 experiments.(D) Frames from Movie S2 showing a magnified view of the anterior end of an egg chamber expressing UAS-DN-Zip and UAS-mCherry::Jupiter at indicated times (hr:min); border cells (yellow arrow) are attached to anterior FCs (white arrows).Anterior is to the left for this and subsequent figures.

