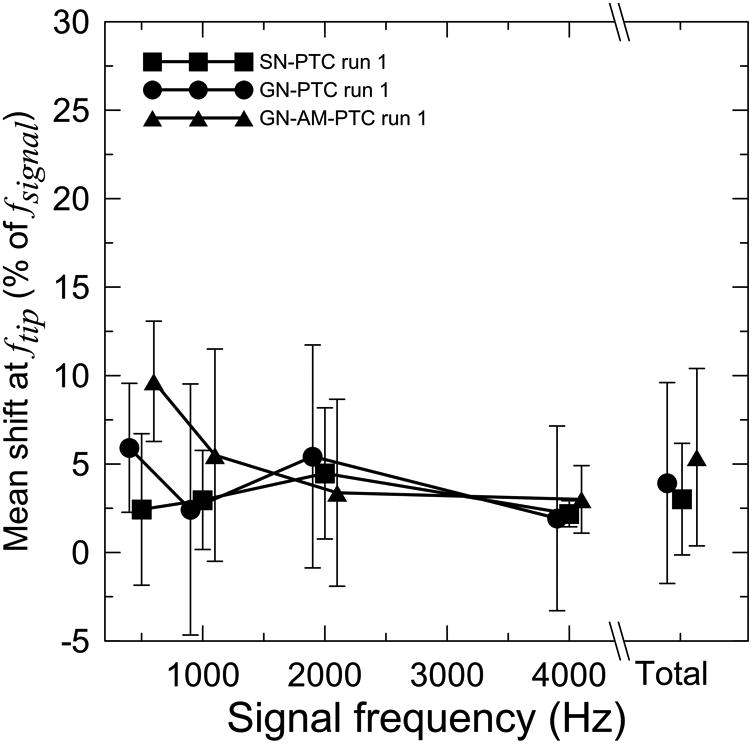
Fig. 4.

Mean shifts in the tip frequency of the PTC (in percent of signal frequency) for the SN-PTC (squares), GN-PTC (circles) and GN-AM-PTC (triangles) methods (run 1) as a function of the signal frequency. The total represents the global mean across fsignal for a given method. Data points are offset slightly for clarity. Error bars represent ±1 standard deviation.
