
Fig. 3. Analysis of transitions at various embedding parameters.
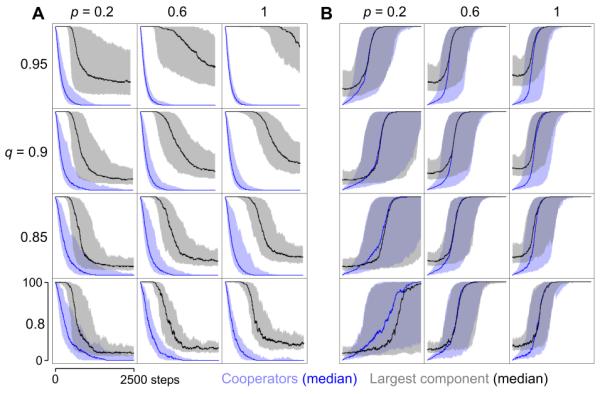
Median number of cooperators and size of largest component (dark lines) over time, considering all the transitions observed in individual runs with various combinations of embedding parameters. Other parameters as Fig. 2. The shaded regions represent the 10% (lower bound) and 90% (upper bound) quantiles for the corresponding medians. Consult the Electronic Supplementary Information for the results on the complete range of the embedding parameters.