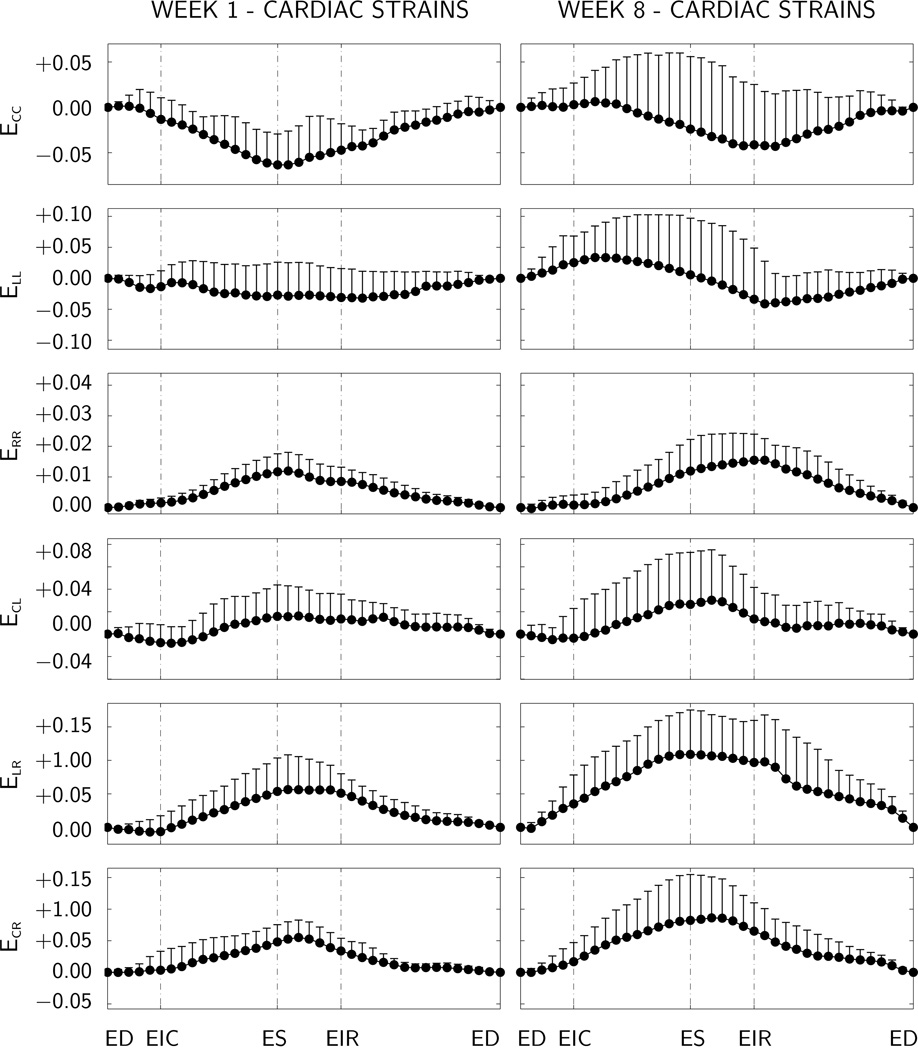
Figure 4.
Temporal evolution of elastic strains at weeks 1 and 8, displayed at 50% depth of the lateral left ventricular wall. Maximum circumferential contraction ECC is −6.34±3.73% at week 1 and −4.31±5.79% at week 8, maximum wall thickening ERR is 11.96±6.09% at week 1 and 15.48±7.05% at week 8. Means and standard deviations of time-aligned components of the Green Lagrange strains are displayed for n=11 animals. C circumferential, R radial, and L longitudinal direction. ED end diastole, EIR end isovolumetric relaxation, ES end systole, and EIC end isovolumetric contraction.

