
. 2012 Feb 1;38:6. doi: 10.1186/1824-7288-38-6
Copyright ©2012 Romagnoli et al; licensee BioMed Central Ltd.
This is an Open Access article distributed under the terms of the Creative Commons Attribution License (http://creativecommons.org/licenses/by/2.0), which permits unrestricted use, distribution, and reproduction in any medium, provided the original work is properly cited.
Figure 2.
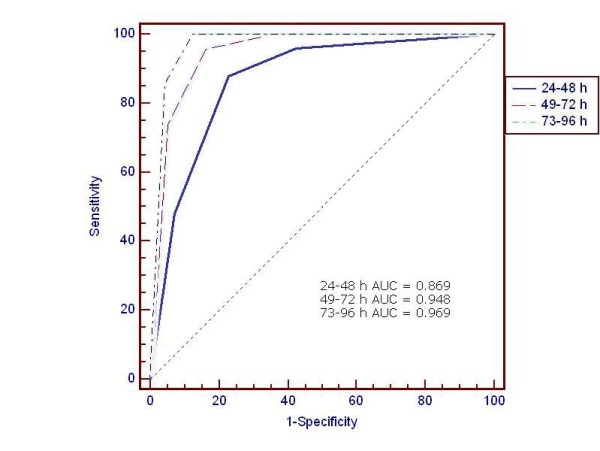
Comparison of the ROC curves during different hours of age.