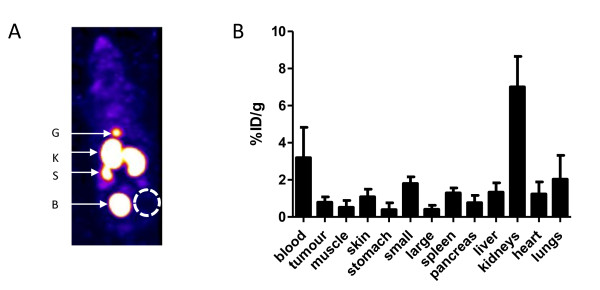
Figure 5.
In vivo biodistribution of 111In-BnDTPA-F3. (A) Representative SPECT image of the distribution of 111In-BnDTPA-F3 in 231-H2N xenograft-bearing mice, 3-h post-intravenous injection. G, gall bladder; K, kidneys; S, spleen; B, bladder. (B) Biodistribution of 111In-BnDTPA-F3, 3-h post-intravenous injection. Results are expressed as the average percentage of the injected dose per gram (%ID/g) of tissue ± SD of the three mice.

