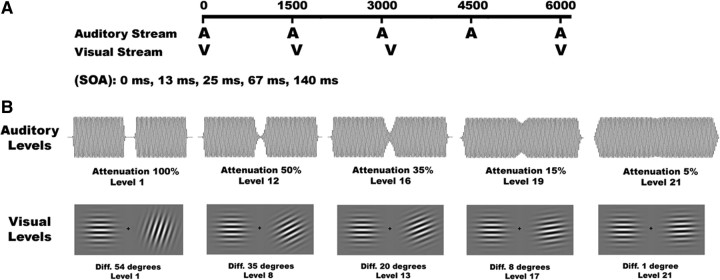
Figure 1.
Example trial sequence. A, A trial was composed of an auditory-alone (10%), a visual-alone (10%), or a bimodal (80%) stimulus. The intertrial interval was set to 1500 ms, measured between consecutive auditory stimulus onsets. The SOA between the auditory and visual stimuli randomly varied between 0, 13, 25, 67, and 140 ms. Subjects were required to respond with a button push to targets within the attended modality. B, Example auditory (top) and visual (bottom) stimuli at various difficulty levels. Auditory targets were identifiable by a slight amplitude reduction in the center of the tone. Visual targets were Gabor patches of different orientation. Difficulty was adaptively varied according to the subjects' online performance.

