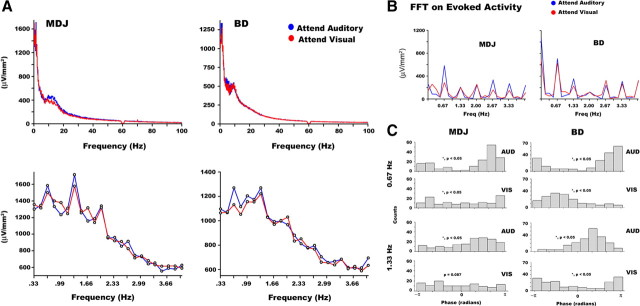
Figure 3.
Spectral analysis using FFT. A, FFT spectrum (on a single-trial basis) during attend-auditory and attend-visual conditions at electrode E14 (MDJ) and electrode E10 (BD). The lower graphs show spectral peaks evident at 0.67 Hz, as well as, at its second and third harmonics in both attention conditions and both subjects. B, A 6 s FFT spectrum (on the averaged waveform) centered on the onset of the auditory stimulus during attend-auditory and attend-visual conditions at electrode E14 (MDJ) and electrode E10 (BD). The graphs show the greatest peak in the spectrum range 0–4 Hz at 0.67 Hz (i.e., the first harmonic). In addition, the spectrum shows a significant drop in power in the second harmonic (i.e., 1.33 Hz) in both participants. C, Histograms illustrating the phase distribution of the 0.67 and 1.33 Hz frequency components at 0 ms for each attention condition in the same electrodes. In both participants, significantly nonuniform phase distributions were measured for both attention conditions at the first and second harmonics, and the circular means differed significantly between attention conditions.

