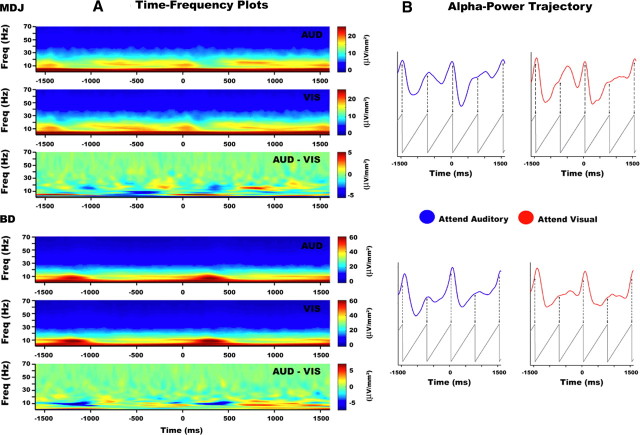
Figure 4.
Attention effects in the time–frequency domain. A, Wavelet transform amplitude from 1.33–70 Hz is shown in electrodes E14 (MDJ) and E10 (BD) for the attend-auditory (upper) and attend-visual (middle) conditions and the difference (bottom) (dominant 0.67 Hz component not shown for visual display purposes). B, Average alpha-power time course plotted over two consecutive trials with superimposed 1.33 Hz sawtooth wave for timing reference. Times −1500, 0, and 1500 refer to the onset of an auditory stimulus. Alpha-amplitude peaks occurring at different instantaneous phase points during the interstimulus-interval between attention conditions. The average time for when these peaks occurred was ∼740 ms across both participants and conditions. This effect is most clearly seen in the period preceding the onset of the auditory stimulus. Note that there are some differences in the alpha-trajectory between the intermediate periods before and after the onset of the middle auditory stimulus. We believe that these small discrepancies should disappear with a larger number of trials.

