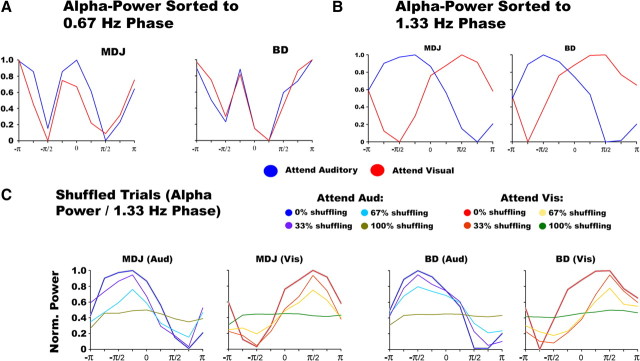
Figure 6.
Cross-frequency phase/amplitude coupling. A, Cross-frequency coupling between alpha (8–14 Hz) amplitude plotted as a function of 0.67 Hz phase. B, Cross-frequency coupling between alpha (8–14 Hz) amplitude plotted as a function of delta (1.33 Hz) phase. C, Temporal shuffling of alpha-band power as a function of 1.33 Hz phase. The figure shows that the phase–amplitude cross-frequency coupling systematically gets reduced with temporal shuffling of the alpha power. The gray lines, which are plotted over the 0% shuffled trials, indicate the standard error for each bin. All the data come from electrode E14 in participant MDJ and E10 in participant BD.

