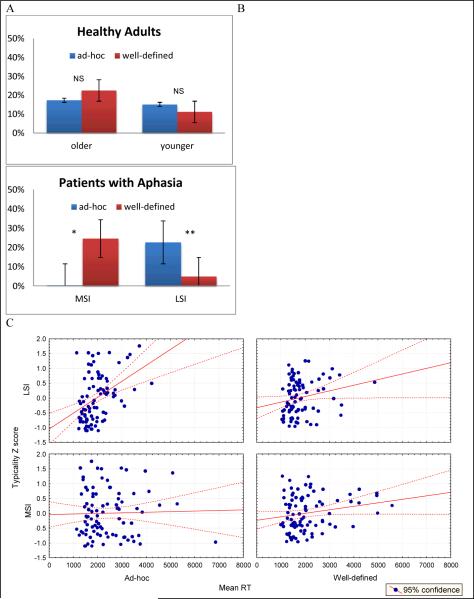
Figure 3.
Percent facilitation of typicality calculated from reaction time data for A) neurologically healthy groups and B) patient groups across category type and C) correlation between typicality and reaction time for patient groups.
Neurologically healthy groups consist of older and younger adults. Patient groups consist of MSI and LSI patients. Category types are ad-hoc and well-defined. See text for formula used to calculate typicality facilitation effect. For correlation, positive Z scores indicate atypical items and negative Z scores indicate typical items. Error bars represent standard error, **p < .01, *p < .05, NS = not significant, MSI = more semantic impairment, LSI = less semantic impairment.

