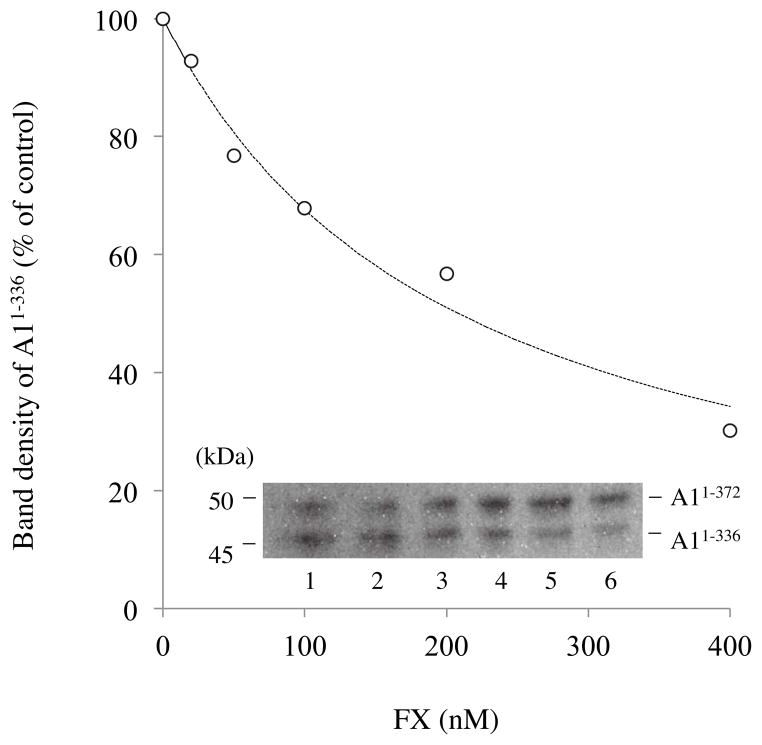
Figure 3. Effect of FX on A1 cleavage at Arg336 by APC.
Mixtures of FVIIIa (130 nM) and various concentrations of FX were incubated with APC (2 nM) and PSPCPE (100 μM) in HBS-buffer containing 2 mM CaCl2 for 10 min. Samples were run on 8% gels followed by Western blotting using an anti-A1 monoclonal antibody, 58.12. Inset: Lanes 1–6 show the A1 cleavage of FVIIIa in the presence of FX (0, 20, 50, 100, 200, and 400 nM, respectively). The graph shows quantitative densitometry of the A1336 product. Density values of A1336 generated by APC cleavage in the absence of FX were used to represent the 100% level. Data were fitted by nonlinear least squares regression using Equation 2 (competitive inhibition model) and shown as a dashed line. Experiments were performed at least three separate times and typical results are shown.

