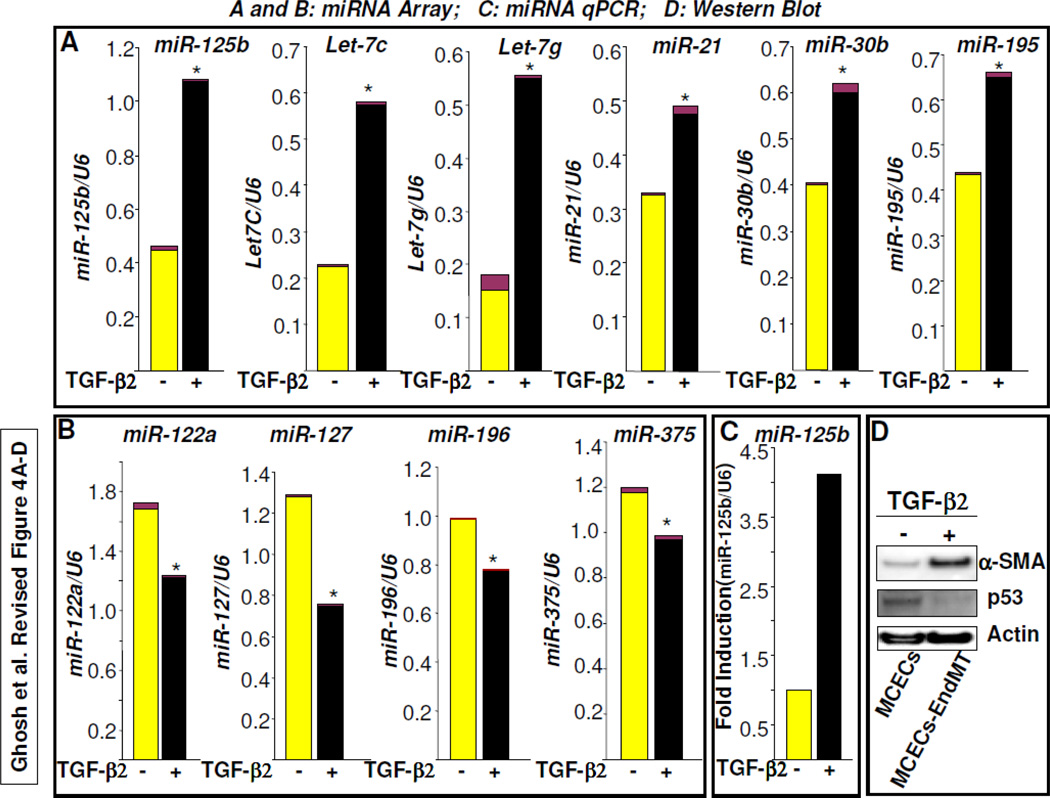
Figure 4. Differential expression of microRNAs during EndMT.
MCECs were treated with TGF-β2 for 7 days and total RNA was extracted from three plates and pooled. Equal amounts of RNA were subjected to miRNA array (A,B) and qPCR analysis (C). The levels of individual miRNA expression relative to U6 expression were quantified and presented as mean ± SEM. Note: * denotes P<0.05 vs. MCECs. The levels of miR-125b, Let7C, Let-7g, miR-21, miR-30b and miR-195 in miRNA array were upregulated during EndMT (A); the levels of miR-122a, miR-127, miR-196, and miR-375 were downregulated during EndMT (B). The levels of miR-125b in MCECs and TGF-2-induced EndMT-derived cells were further determined by microRNA qPCR and data were presented as fold induction of miR-125b relative to U6 expression in EndMT-derived fibroblast-like cells compared to MCECs (C). Total protein extracted from MCECs (control) and EndMT-derived fibroblast-like cells were subjected to western blot using antibodies against p53, α-SMA and actin. Note: while EndMT marker α-SMA was upregulated, the miR-125b target gene p53 protein level was significantly decreased (D).

