Fig. 4.
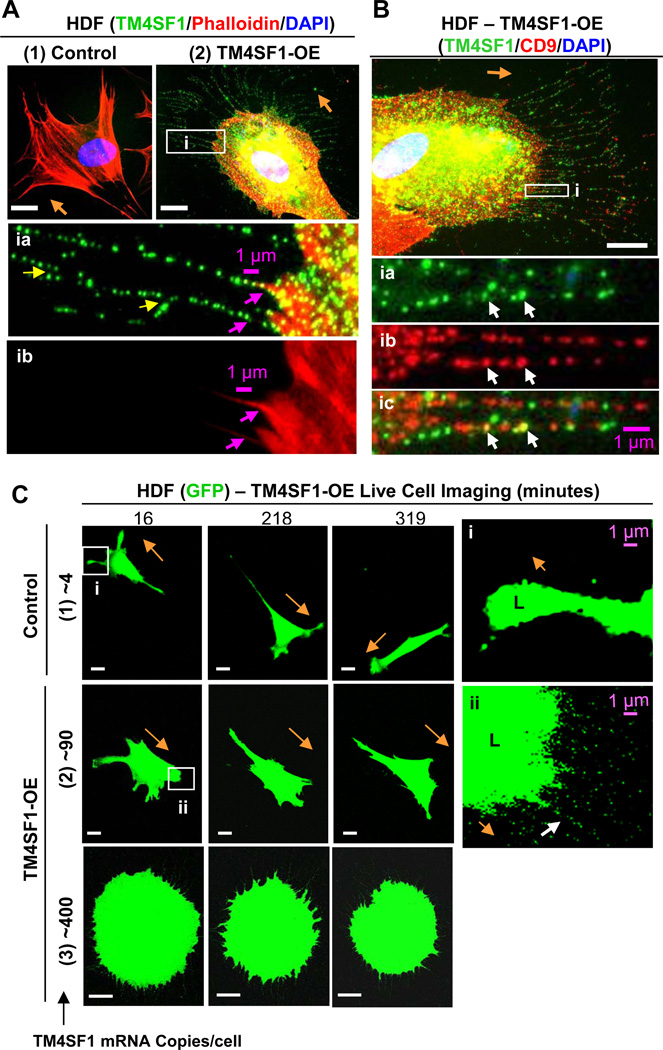
HDF form nanopodia and alter their migration pattern following transduction with TM4SF1. HDF were transfected for 48h with empty vector (control) or TM4SF1 adenoviruses and subcultured at 60% confluence for 2h prior to immunostaining (A,B) or live cell imaging (C). (A1) Representative immunofluorescence image of HDF transduced with empty vector at 15 moi demonstrate lack of TM4SF1 staining. (A2) HDF transduced with 15 moi expressed TM4SF1 at ~90 mRNA copies/cell and acquired prominent, broadly rounded lamellipodia from which projected branching (yellow arrows) nanopodia that immunostained with TM4SF1 at a periodicity similar to that of EC nanopodia (inset ia). F-actin was confined proximally (insets ia and ib, pink arrows). (B) HDF expressing ~90 mRNA copies of TM4SF1/cell exhibited an intermittent staining pattern of both TM4SF1 and CD9 with only occasional co-localization (inset i, white arrows). (C) Representative time-lapse images of GFP-transduced HDF that were empty vector control- and TM4SF1-transduced at 15 or 50 moi to express TM4SF1 at ~90 or ~400 mRNA copies/cell. (1) Empty vector (control) transduced HDF exhibited a typical fibroblast migration pattern, projecting relatively narrow, splayed lamellipodia (L, inset i) and changing directions only every 3–5 h. (2) HUVEC transduced with both TM4SF1 (~90 mRNA copies/cell) and GFP projected prominent, larger, and more broadly rounded lamellipodia (L, inset ii) from the leading front and moved continuously in the direction of nanopodia projection (white arrow). (3) TM4SF1 (~400 mRNA copies/cell) and GFP co-transduced HDF projected numerous nanopodia from the entire cell perimeter and movement was impaired. Orange arrows indicate direction of cell migration. White scale bars, 10 µm.

