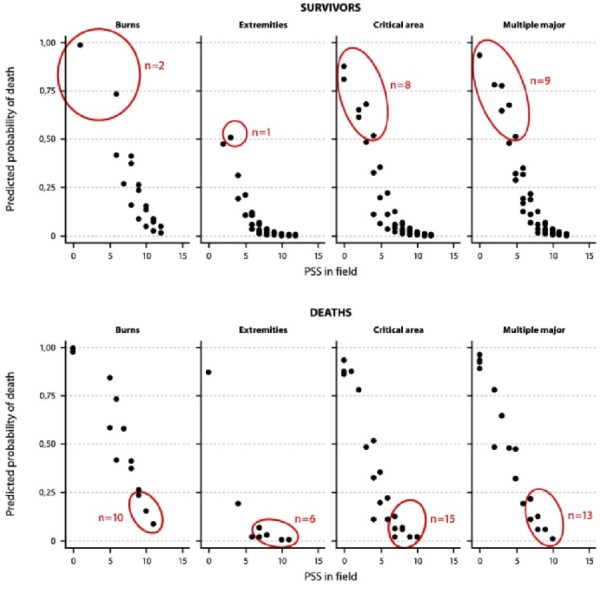
Figure 4.

Probabilistic model to identify unexpected survivors and unexpected fatalities. In the scatter plot, survivors and fatalities are grouped by predicted probabilities of death, and physiological severity scores registered at the first in-field encounter (PSS 1). Red rings mark the unexpected survivors and unexpected deaths. Unexpected survivors were defined as survivors with higher than 50% risk of death according to the probabilistic model; unexpected deaths were defined as fatalities with less than 25% risk of death. "Critical area" implies injuries to the head, neck or the torso.
