
Figure 1.
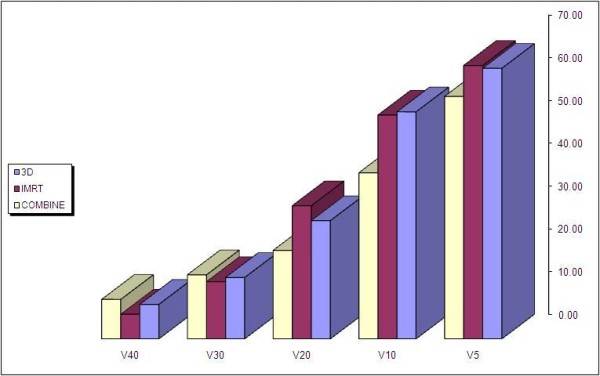
Normalized DVH of PTV and Total Lung - GTV. The graph depicts the relative dose- volume- histogram for the three techniques of 3D, IMRT and combined IMRT + AP-PA after the correction of heterogeneity
Official websites use .gov
A
.gov website belongs to an official
government organization in the United States.
Secure .gov websites use HTTPS
A lock (
) or https:// means you've safely
connected to the .gov website. Share sensitive
information only on official, secure websites.
Normalized DVH of PTV and Total Lung - GTV. The graph depicts the relative dose- volume- histogram for the three techniques of 3D, IMRT and combined IMRT + AP-PA after the correction of heterogeneity