
Figure 5.
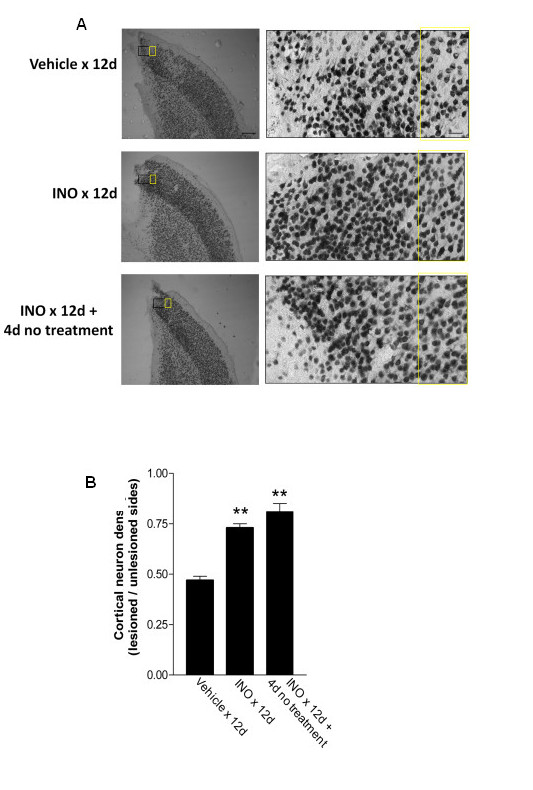
Neuronal density in the peri-lesion area. (A) Immunostaining for neurons (NeuN) in brain sections from rats treated as described in Fig. 4. The black and yellow rectangles in the low power views (left) show the regions magnified in the high power views (right). Cell counts were made in the regions identified in the yellow rectangle, 400 μm lateral to the lesion cavity edge, and in the homologous cortex of the contralateral hemisphere (not shown). Scale bars are 400 μm (low power views) and 40 μm (high power views). (B) Neuronal density was expressed in each animal as the ratio of densities in the lesioned and non-lesioned hemispheres. n = 4-5; *P < 0.05 vs. vehicle.