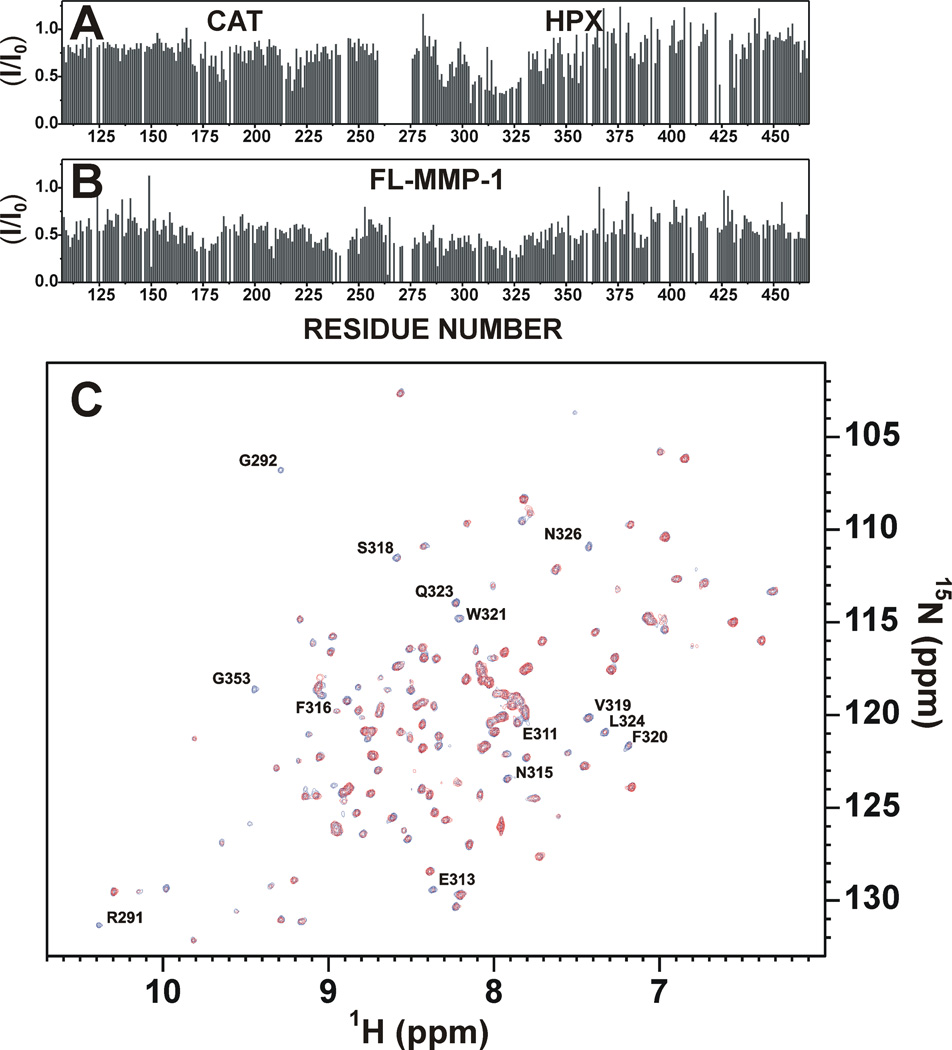
Figure 3.
(A) Intensity changes per residue observed at 310 K for isolated 15N FL-MMP-1 domain upon the addition of unlabeled THP (0.4 eq). (B) Intensity changes per residue observed at 310 K in isolated 15N CAT and HPX domains upon the addition of unlabeled THP (0.8 eq). (C) 1H-15N HSQC spectra shows HPX domain before (blue) and after (red) the addition of THP (0.8 eq). Residues experiencing a large decrease in signal intensity are labeled in the spectra.

