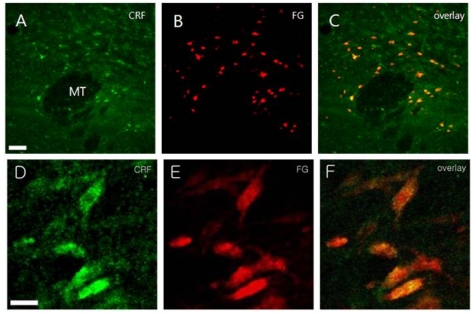
Fig. 4.
Low (A~C) and high magnification (D~F) microphotographs showing the distribution of corticotropin releasing factor (CRF)-like immunoreactive cells (A, D; in green) and retrogradely labeled cells (B, E; in red) after acute IMO stress. The overlay of images A+B, D+E is shown in C, F, respectively where yellow color illustrates co-localization of CRF with retrogradely labeling. Scale bar in A, 100µm; D, 20µm. MT, mammillothalamic tract.

