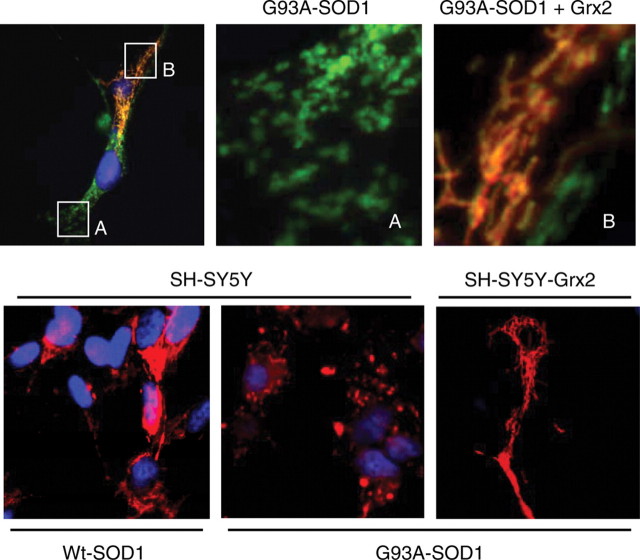
Figure 4.
Effect of Grx2 on mitochondrial morphology. Top panel: NSC-34 cells expressing the cDNA encoding G93A mutSOD1 under control of the inducible Tet-On promoter as described in Materials and Methods and transfected with a plasmid coding for mitochondrial Grx2 were stained with an antibody recognizing the mitochondrial enzyme SOD2 (green) and an antibody against Grx2 (red). (A) and (B) are enlargements of the corresponding insets. Bottom panel: SH-SY5Y cells, either untransfected or stably overexpressing Grx2, were infected as indicated with an adenoviral vector leading the expression of SOD1 (wild-type or mutant G93A-SOD1). Staining: SOD2 (red) and Hoechst (nuclei).

