
Figure 5.
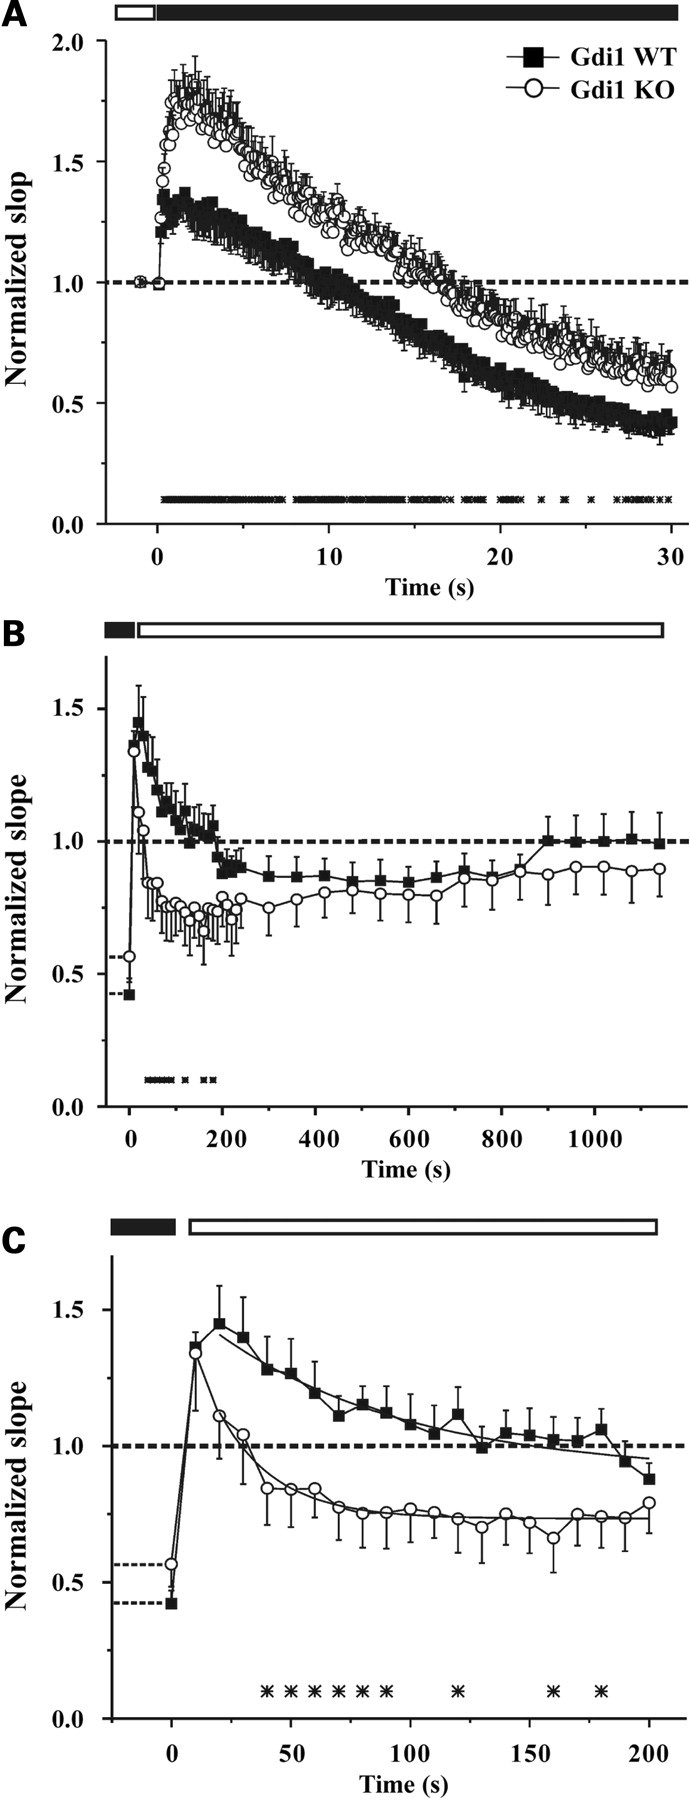
Depression and recovery from depression are altered in Gdi1 mutant neurons subjected to high-frequency stimulation. (A) fEPSP normalized relative to the baseline, was plotted as means ± SEM versus time during repetitive stimulation at 10 Hz for 30 s (n = 9 for both WT and KO slices). (B) The recovery from depression was analyzed by lowering the stimulation frequency from 10 to 0.1 Hz. The time-course of recovery was studied for 20 min after the end of the train in WT (n = 8) and KO mice (n = 7). (C) In an expanded time scale, a detail of the first 3 min of the recovery phase shown in (B) reveals that PTP lasted 2 min in WT slices, while it was rapidly lost and replaced by a phase of depression in KO slices. The time course of the PTP loss was fitted using the monoexponential function: y = yo + A1 × exp(−t/t) yielding the following values: t = 60.76 ± 10 and 19.36 ± 4.7 s. In all panels, the differences between the two genotypes were significant at the time points marked with asterisks (*P < 0.05, unpaired Student’s t-test).