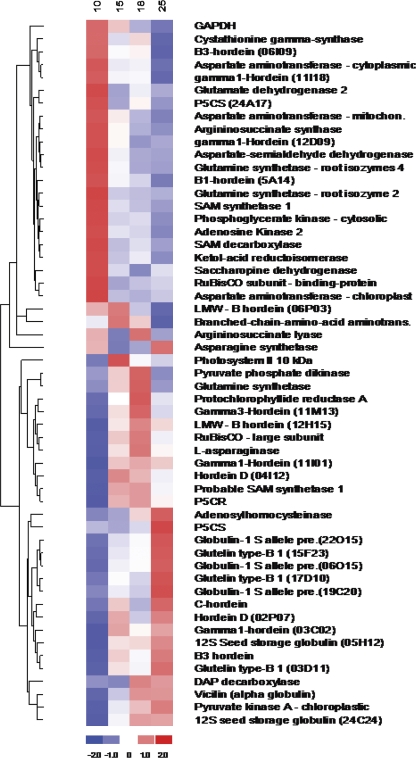
Fig. 3.
Hierarchical clustering of genes. Heat map of hierarchical clustering for 55 selected differentially expressed genes: horizontal rows represent individual genes and vertical rows represent individual time points. Red and blue indicate transcript level above and below the median for that gene across all samples, respectively. Distinct clusters of differentially expressed genes can be seen for early, middle, and late developmental stages.

