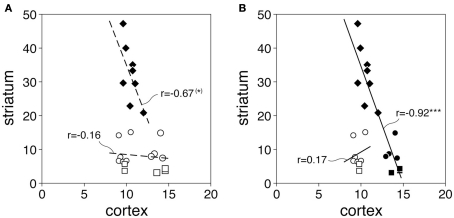
Figure 5.
Inverse relationship between cortical and striatal CB1 expression in specific corticostriatal circuits. The scatterplots (A,B) depict CB1 expression (mean density; P25, P40, P70 averaged) in cortical areas and their striatal target sectors for the 23 corticostriatal circuits examined. Values for the 8 sensorimotor circuits (diamonds), 10 associative/limbic circuits (circles), and 5 limbic/NAc circuits (squares) are displayed. Results (B) show a negative correlation between cortical and striatal CB1 expression for pooled sensorimotor circuits plus associative/limbic/NAc circuits with inputs from medial prefrontal cortex (IL, PL, CG; see Figure 2) (filled symbols, n = 15; r = −0.92, ***P < 0.0001). (*)P = 0.07.

