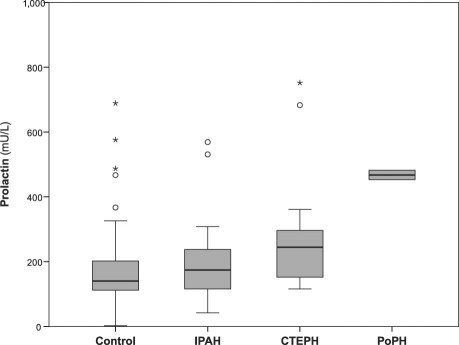
Fig. 5 Box plot shows median and interquartile range of serum levels of prolactin in pulmonary hypertension subgroups: control, idiopathic pulmonary artery hypertension (IPAH), chronic thromboembolic pulmonary hypertension (CTEPH), and portopulmonary hypertension (PoPH). Four extremes for prolactin are not shown in the figure due to the scaling.° = outliers; * = extremes

An official website of the United States government
Here's how you know
Official websites use .gov
A
.gov website belongs to an official
government organization in the United States.
Secure .gov websites use HTTPS
A lock (
) or https:// means you've safely
connected to the .gov website. Share sensitive
information only on official, secure websites.
