
Figure 1.
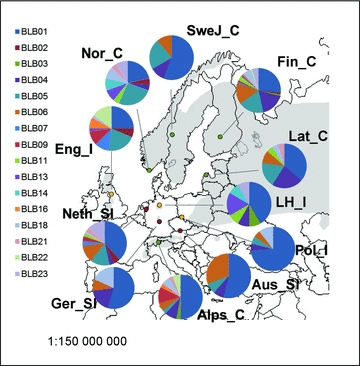
Map of Europe showing pie charts for each population with frequency of MHC class II alleles. The black grouse distribution range is shown in grey (distribution map from Storch 2007). The colors of the dots (and the names) indicate the population category; green for continuous (_C), yellow for isolated (_I), and red for small isolated populations (_SI). Population code in Table 1.